How to Read Financial Reports for Smart Investing
Learn how to read financial reports with our guide to the balance sheet, income statement, and cash flow statement. Make smarter investment decisions today.

Cracking open a company’s annual report for the first time can feel like you’ve been handed a textbook in a language you don't speak. They're dense, packed with jargon, and frankly, a little intimidating. But here’s the secret: you don’t need to be a CPA to make sense of it all.
The real story of a company’s financial health boils down to just three key documents. Think of them as different camera angles on the same subject. One gives you a static photo, another a video of the action, and the third follows the money. You need all three to see the full picture.
The Three Core Financial Statements
Mastering these documents is the first, and most important, step in any real financial analysis. Everything else builds on this foundation.
- The Balance Sheet is a snapshot. It tells you what a company owns (assets) and what it owes (liabilities) on a single day, along with the owners' piece of the pie (equity).
- The Income Statement is more like a movie. It shows you the company's performance over a specific period—a quarter or a year—revealing its revenues and, most importantly, whether it turned a profit.
- The Statement of Cash Flows is the reality check. It tracks the actual cash moving in and out of the business, showing you exactly where money came from and where it went.
Getting this right is crucial. Just think back to the Enron scandal in 2001. The company used accounting loopholes to manipulate its financial statements, hiding billions in debt. When the truth came out, it led to a spectacular collapse that vaporized $74 billion in shareholder value. That fiasco led directly to the Sarbanes-Oxley Act of 2002, which tightened up auditing rules and helped slash the number of financial restatements by 42% in the years that followed.
The goal isn’t to become an accountant overnight. It's to develop the confidence to ask the right questions and find the answers within the numbers. This skill separates casual observers from informed investors and business leaders.
To help you get a quick handle on these reports, here’s a simple breakdown of what each one does.
The Three Core Financial Statements at a Glance
| Financial Statement | What It Shows | Key Question It Answers |
|---|---|---|
| Balance Sheet | A snapshot of assets, liabilities, and equity at a specific point in time. | What does the company own and owe? |
| Income Statement | A summary of revenues, expenses, and profits over a period of time. | Is the company profitable? |
| Statement of Cash Flows | The movement of cash from operating, investing, and financing activities. | Where is the cash coming from and going? |
This table serves as your cheat sheet. As you dive deeper, you’ll see how the numbers from one statement flow into and connect with the others, weaving together the complete financial narrative.
For a more detailed walkthrough of how to read company financial statements comprehensively, that resource is a great next step. And when you’re facing a hundred-page PDF report, using a free PDF summarizer can be a lifesaver. It helps you pull out the most important figures and summaries right away, so you can get your bearings before diving into the weeds.
Decoding the Balance Sheet
Think of the balance sheet as a financial x-ray. It gives you a powerful, static snapshot of a company's health at a single point in time. Everything on it boils down to one beautifully simple formula: Assets = Liabilities + Equity. This means everything a company owns (its assets) was paid for by either borrowing money (liabilities) or using funds from its owners (equity).
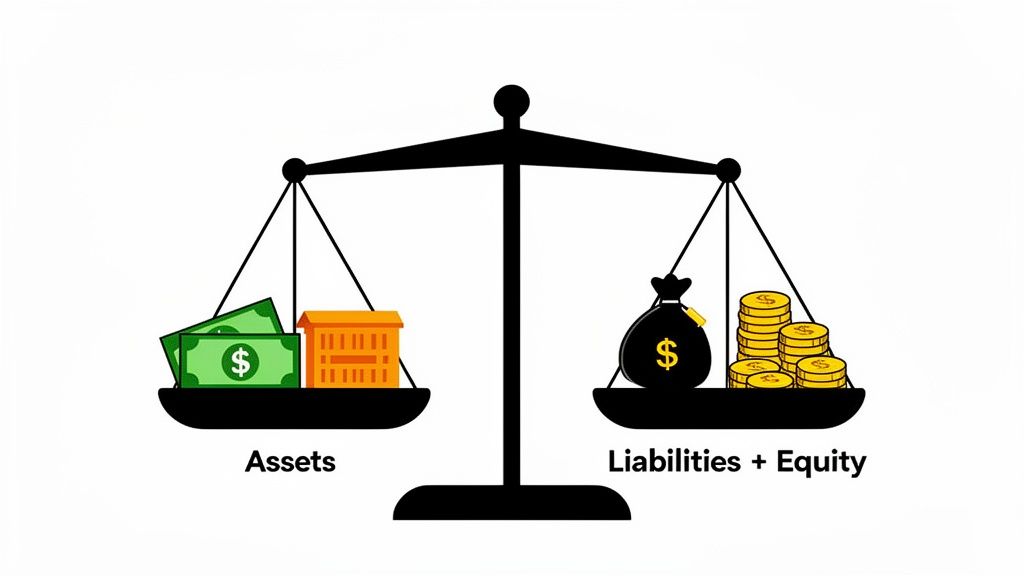
Getting your head around how this equation works isn't just an accounting rule—it's the core logic that holds the entire financial story together. Once it clicks, you're well on your way.
What the Company Owns: Assets
Assets are simply the economic resources a company controls. They're usually split into two main camps based on how quickly they can be turned into cash.
- Current Assets: These are resources expected to be used up or converted into cash within a year. We're talking about the cash in the bank, inventory on the shelves, and accounts receivable—the money customers owe for products they've already received.
- Non-Current Assets: This is the long-term stuff that isn’t easily liquidated. It includes physical things like property, plant, and equipment (often called PP&E) and intangible assets like patents or goodwill, which is the premium paid to acquire another company above its asset value.
A healthy company usually has a good mix of both, giving it the cash to run day-to-day operations while still investing in things that will fuel future growth. But owning assets is only half the picture. Now, let’s look at how they were paid for.
What the Company Owes: Liabilities
Liabilities are the company's debts—what it owes to others. Just like assets, they’re categorized by when they need to be paid.
- Current Liabilities: These are the bills due within the next year. Think of accounts payable (what the company owes its suppliers), short-term loans, and the current portion of any long-term debt.
- Long-Term Liabilities: These are obligations that don't need to be settled for more than a year. This bucket includes things like long-term bank loans, bonds issued to investors, and pension obligations.
The mix between current and long-term liabilities can tell you a lot about the financial pressure a company is under. A pile of short-term debt can be a major red flag for liquidity risk, so I always pay close attention here. This kind of financial literacy has massive real-world impacts. For instance, some research shows that just a 1% increase in financial literacy can slash household loan defaults by 2.8 percentage points. If you're interested in the broader topic, you can discover more insights about financial security from the 2025 Global Financial survey.
Shareholder's Equity, also called net assets or book value, is what’s left for the owners after all the company's debts are paid off. It’s their actual stake in the business.
Using Ratios for Quick Insights
The real magic happens when you start comparing these numbers. With a couple of quick calculations, you can get an instant read on a company's financial stability right from the balance sheet.
One of the first I always look at is the Current Ratio, which is Current Assets / Current Liabilities. A ratio above 1 is a good sign, suggesting the company has enough short-term resources to cover its short-term bills.
Another critical metric is the Debt-to-Equity Ratio (Total Liabilities / Shareholder's Equity). This shows you how much the company is leaning on debt versus its own funds. A high ratio can mean the company is being aggressive to juice its profits, but it also dials up the risk if things take a downturn.
Finding the Story in the Income Statement
If the balance sheet is a snapshot in time, the income statement is the movie. It tells you the story of how a company performed over a specific period, whether that's a quarter or a full year. Think of it as a journey from the very first dollar of sales down to the final profit left in the bank.
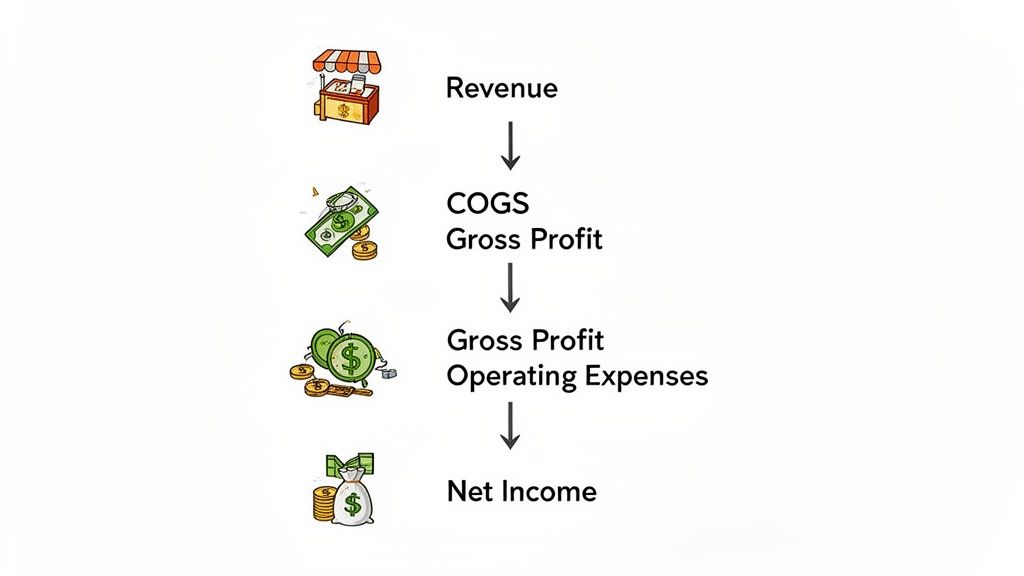
This journey always kicks off with Revenue (you'll often see it called "sales"). This is the top-line number—the total cash generated from whatever the company sells before a single expense is paid. But, of course, a business never gets to keep all of it.
From Revenue to Gross Profit
The first major expense you'll see is the Cost of Goods Sold (COGS). This isn't about marketing or office rent; it’s the direct cost of making what you sell. For a car company, that means steel and tires. For a software company, it might be server costs.
Subtract COGS from Revenue, and you get Gross Profit. This number is a gut check on the company's core business model. It tells you how much money is left over to pay for everything else. I always calculate the Gross Profit Margin (Gross Profit / Revenue) right away. It’s a powerful indicator of production efficiency.
A consistently high Gross Profit Margin often signals a company has a real competitive edge. It either means they can produce things very cheaply or they have enough brand power to charge a premium.
Unpacking Operating Expenses
With gross profit calculated, the next set of costs are what it takes to actually run the business day-to-day. These are the Operating Expenses.
They typically fall into a few key buckets:
- Selling, General & Administrative (SG&A): This is a broad category for everything from executive salaries and marketing campaigns to the office electricity bill.
- Research & Development (R&D): For any company in tech or pharmaceuticals, this line is crucial. It’s their investment in the future.
When you subtract these operating costs from gross profit, you arrive at Operating Income. This is a fantastic measure of a company’s primary profitability, stripped of any financing or tax quirks. You'll often hear investors talk about EBITDA (Earnings Before Interest, Taxes, Depreciation, and Amortization) at this stage, as it gives an even cleaner view of pure operational cash flow.
When you're digging through a long report, a tool like PDF Summarizer can be a lifesaver. You can ask it to pull specific figures like "What were the operating expenses?" and it will extract the number directly from the text, complete with a source citation so you can verify it instantly.
Reaching the Bottom Line
We're almost at the end of the story. After accounting for any interest paid on debt and all the taxes owed, you finally get to the famous Net Income—the "bottom line." This is what's left. It's the company's actual profit after every single bill has been paid.
From here, we get the most scrutinized ratio of them all: the Net Profit Margin (Net Income / Revenue). This tells you exactly what percentage of each dollar in sales becomes pure profit. If a company has a 15% net profit margin, it means for every dollar of revenue, it keeps $0.15 as profit.
But a single number is just one chapter. The real insight comes from tracking these margins over several quarters or years. Is the company getting better at turning sales into profit, or are its margins shrinking? That trend is what separates a business that's getting stronger from one that's just treading water.
Following the Money with the Cash Flow Statement
The income statement might tell you if a business is supposedly profitable, but the cash flow statement is where the truth comes out. It’s the ultimate reality check. Why? Because as the old saying goes, profit is an opinion, but cash is a fact.
This report tracks the actual dollars moving in and out of the company's bank accounts. It answers a refreshingly simple question: where did the cash come from, and where did it go? The story unfolds across three distinct sections, and learning to read them feels like piecing together a financial narrative.
Cash From Operations
This is the engine room. Cash Flow from Operating Activities (CFO) shows you the cash generated by the company’s day-in, day-out business. We're talking about the money made from actually selling widgets or providing services.
A strong, positive CFO is one of the best signs you can hope to see. It signals that the core business is healthy and self-sustaining, generating more cash than it burns. If a company boasts a huge net income but has negative operating cash flow, that’s a massive red flag. It’s a classic sign of trouble that demands investigation.
Don't just take my word for it. Investor reliance on financial reports holds steady at 69%. More importantly, after 2020, firms with positive operating cash flow saw their stock prices outperform others by a staggering 28%. This really drives home how vital this metric is for sanity-checking a company's earnings. You can discover more about these investor trends and their implications.
Cash From Investing and Financing
These next two parts of the statement round out the story. They reveal how the company is putting its cash to work for future growth and how it's managing its funding structure.
Cash Flow from Investing Activities (CFI): This section tracks the cash spent on investments. Seeing a negative number here is often a good thing. It typically means the company is investing in its future by buying assets like new factories, equipment, or even other companies.
Cash Flow from Financing Activities (CFF): Here, you see the cash flow between the company, its owners, and its lenders. This includes everything from issuing or buying back stock to taking on new loans or paying down existing debt.
Key Takeaway: The classic profile of a healthy, growing company is positive cash from operations (the engine is running), negative cash from investing (it's reinvesting for growth), and a financing flow that makes sense for its strategy, whether that’s paying down debt or returning capital to shareholders.
Finally, this brings us to one of the most powerful metrics in all of finance: Free Cash Flow (FCF). You calculate it as Cash from Operations - Capital Expenditures. FCF is the pure, unadulterated cash the company has left after paying for everything it needs to run and grow its business. This is the cash available to pay dividends, slash debt, or pounce on new opportunities.
When you're digging through these dense reports, don't forget you can give yourself a serious edge. Our guide on how to extract information from PDF documents walks you through how to quickly pinpoint key figures and summaries, which can save you an enormous amount of time.
Putting It All Together: From Three Statements to One Story
Think of the three financial statements as individual snapshots. Each one gives you a different angle, but the real insight—the full story of a company's performance—comes when you overlay them. The skill isn't just reading each report; it's understanding how they talk to each other.
The connections are often quite direct. Take the famous "bottom line" from the Income Statement, the Net Income. It doesn't just vanish into thin air. It flows straight onto the Balance Sheet, boosting the Retained Earnings account under Shareholder's Equity. Right there, you have a clear link showing how a profitable quarter or year strengthens the company's core financial position.
Follow the Money
The Cash Flow Statement is the ultimate connector. It’s the bridge that explains exactly how the cash balance on the Balance Sheet changed from the start of the period to the end.
Let's say you see the Cash line on the Balance Sheet jump from $10 million to $15 million. The Cash Flow Statement is your guide to how that $5 million appeared. It will break down how much came from core business activities, what was spent on new equipment or acquisitions, and how much was raised from investors or paid back to lenders.
This diagram breaks down the three core activities that drive a company's cash.
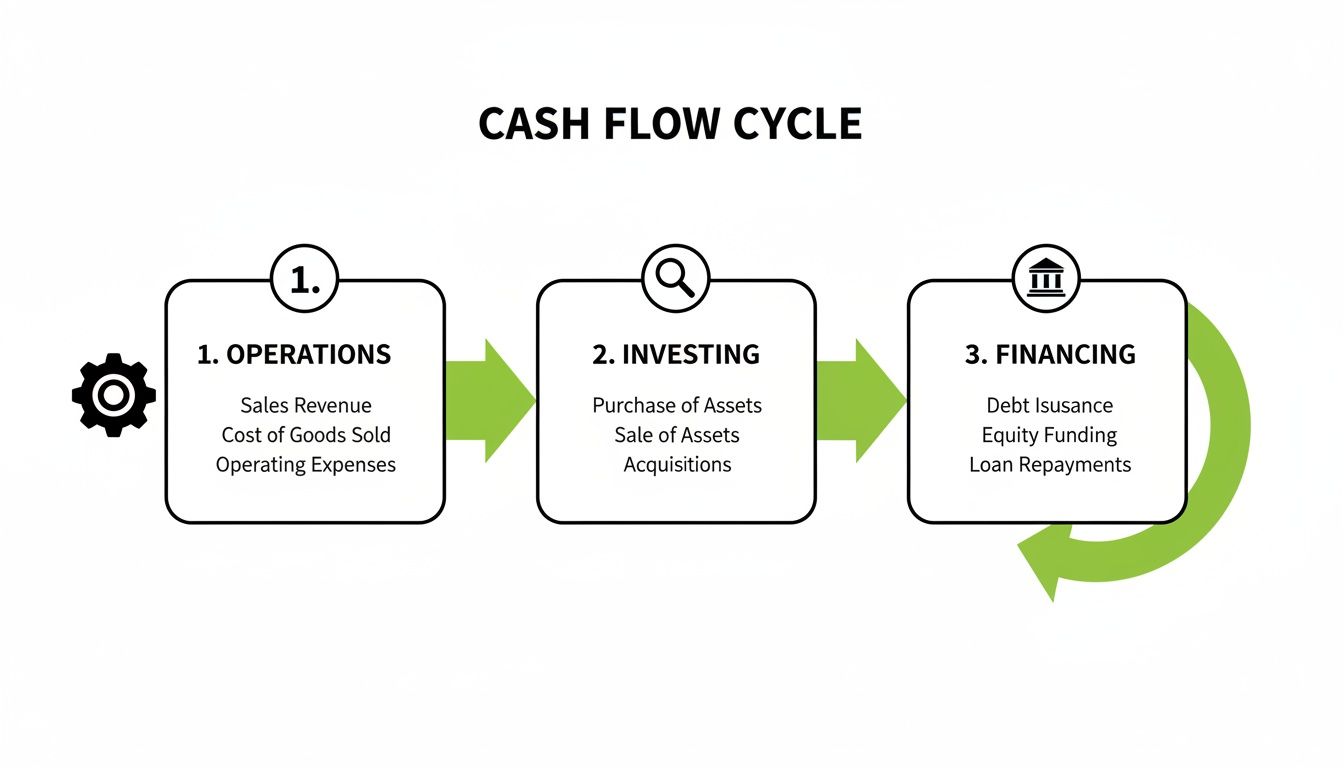
Ideally, you want to see a healthy company generating plenty of cash from its operations. That cash then gets put to work—either reinvested for growth (investing) or used to manage its debts and reward shareholders (financing).
Uncovering the Real Story
This interconnected view is where you spot the red flags that others might miss. One statement might look perfectly fine on its own, but the connections often reveal a less rosy reality.
For example, a company could be reporting impressive, growing net income. Sounds great, right? But if you flip to the Cash Flow Statement and see that its operating cash flow is negative, you’ve found a major problem. It means those "profits" are just on paper and aren't actually turning into spendable cash. This is a classic warning sign of a business in trouble.
This kind of deep dive is what we call document analysis, where you go beyond the surface-level numbers to understand the underlying trends and truths.
The goal is to piece together a narrative. Is the company generating enough cash to pay down its debt? Is it selling off valuable assets just to fund a struggling operation? These are the stories that emerge when you connect the dots between the reports.
To make sure you hit these key points every time, it helps to have a system. A simple checklist can keep your analysis consistent and ensure you don't overlook a critical link.
Your Financial Report Analysis Checklist
Here’s a straightforward checklist you can use to guide your analysis of any company's financial reports. It’s designed to make sure you cover all the critical areas and connections.
| Checklist Item | What to Look For | Key Ratios/Metrics |
|---|---|---|
| Review the Income Statement | Is revenue growing consistently? Are profit margins stable or improving? | Gross Margin, Net Profit Margin |
| Analyze the Balance Sheet | How much debt are they carrying? Do they have enough cash/assets to cover short-term bills? | Debt-to-Equity Ratio, Current Ratio |
| Examine the Cash Flow Statement | Is the core business actually generating cash (positive cash from operations)? | Free Cash Flow (FCF) |
| Connect the Statements | Does Net Income track with operating cash flow? Does profit flow into Retained Earnings? | Compare Net Income to Cash Flow from Operations (CFO) |
Let's put this into a real-world context. Imagine you're looking at a retail company. On the Income Statement, you see revenue is up a healthy 10%. Great start.
But then you look at the Balance Sheet and notice inventory has ballooned by 40%, and total debt has doubled. Alarm bells should be ringing. Finally, the Cash Flow Statement confirms your fears: cash flow from operations is deeply negative.
By connecting these dots, the story becomes crystal clear. The company isn't actually selling more products; it’s just stuffing its warehouses with them. And it's borrowing heavily to fund this non-existent growth. That’s a powerful, actionable insight you would have completely missed by looking at just one statement.
Common Questions About Reading Financial Reports
Once you've got the basics down, you'll find a few questions tend to crop up again and again. Getting these sorted out is key to building real confidence in your analysis. Let's walk through some of the most common ones I hear.
First off, where do you even get these reports? For any public company in the U.S., the official source is the SEC's EDGAR database. This is where you'll find the mandatory annual (10-K) and quarterly (10-Q) filings.
You can also usually find these documents on the company's own website, tucked away in an "Investor Relations" section. These PDFs can be incredibly long, which is where a good summarization tool can save you a ton of time.
Which Financial Statement Is Most Important?
This is the classic question, and the honest answer is: none of them. They're designed to be a set, and reading one without the others is like trying to diagnose a patient by only taking their temperature. Each one gives you a different, crucial piece of the bigger picture.
That said, most experienced analysts have a preferred starting point or workflow. Here’s a common and effective one:
- Start with the Income Statement: This gives you a quick snapshot of performance. Is the company making money? Is revenue on the upswing?
- Then, move to the Balance Sheet: Now you check its underlying health. How leveraged is it with debt? Does it have enough current assets to pay its immediate bills?
- Finish with the Cash Flow Statement: This is the ultimate reality check. It confirms whether the profits you saw on the income statement are actually turning into cold, hard cash.
This sequence tells a story: performance, stability, and then validation.
How Do I Spot Red Flags?
Learning to spot trouble is what separates a novice from a seasoned analyst. You're essentially a detective, looking for trends that don't make sense or numbers that seem out of place.
A huge red flag is when a company reports fantastic profits, but its cash from operations is flat or even declining. This often means the reported earnings are just "paper profits," not backed by actual cash flow.
The footnotes are a happy hunting ground for red flags. This is where companies have to disclose the gritty details they'd rather not put on page one, like changes in accounting policies or hidden liabilities.
Other warning signs to look out for are debt levels that are rising much faster than revenue or assets. Also, be skeptical of companies that constantly report "one-time" expenses or unusual charges—if it happens every year, it's not a one-time thing. It’s just a cost of doing business they’re trying to hide.
Tired of manually digging through dense financial PDFs? PDF Summarizer uses AI to help you find the numbers and insights you need in seconds. Chat with any document, get instant answers with cited sources, and understand complex reports faster. Try PDF Summarizer for free and see how it works.
Relevant articles

Unlock business insights with our guide to financial analysis reports. Learn to interpret statements, use key ratios, and leverage AI for faster analysis.