Master how to read scientific papers: A practical guide
How to read scientific papers: Learn planning, annotation, and critical appraisal to extract actionable insights and improve your research outcomes.
Efficiently diving into scientific papers doesn’t have to be a slog. Over years in the lab, I’ve refined a process that turns stacks of articles into clear insights—and it only takes five core steps.
Reading Roadmap For Scientific Papers
When you open a new research PDF, start by asking one question: does this directly relate to what I’m investigating? If yes, move on; if not, set it aside and save time.
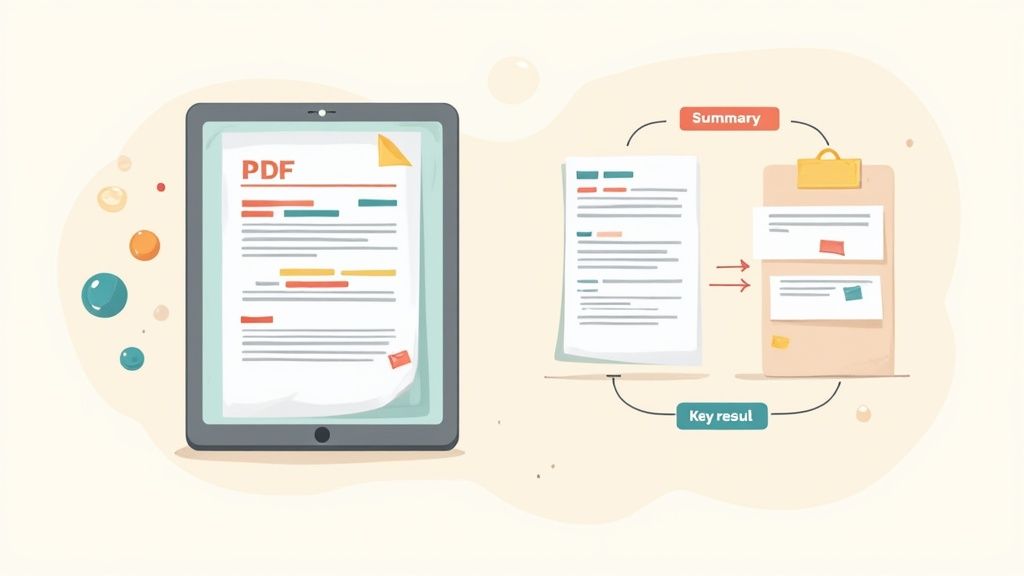
Next, scroll to the abstract and spend no more than two minutes soaking in the objectives and key results. From there, pin your attention on figures and tables—they’re gold mines for spotting trends without wading through paragraphs.
Before diving into methods and discussion, take a quick credibility check. Look for familiar institutions, scan funding declarations, and note the journal’s scope. Finally, jot down a concise summary in your own words—this cements your understanding and builds a personal knowledge base.
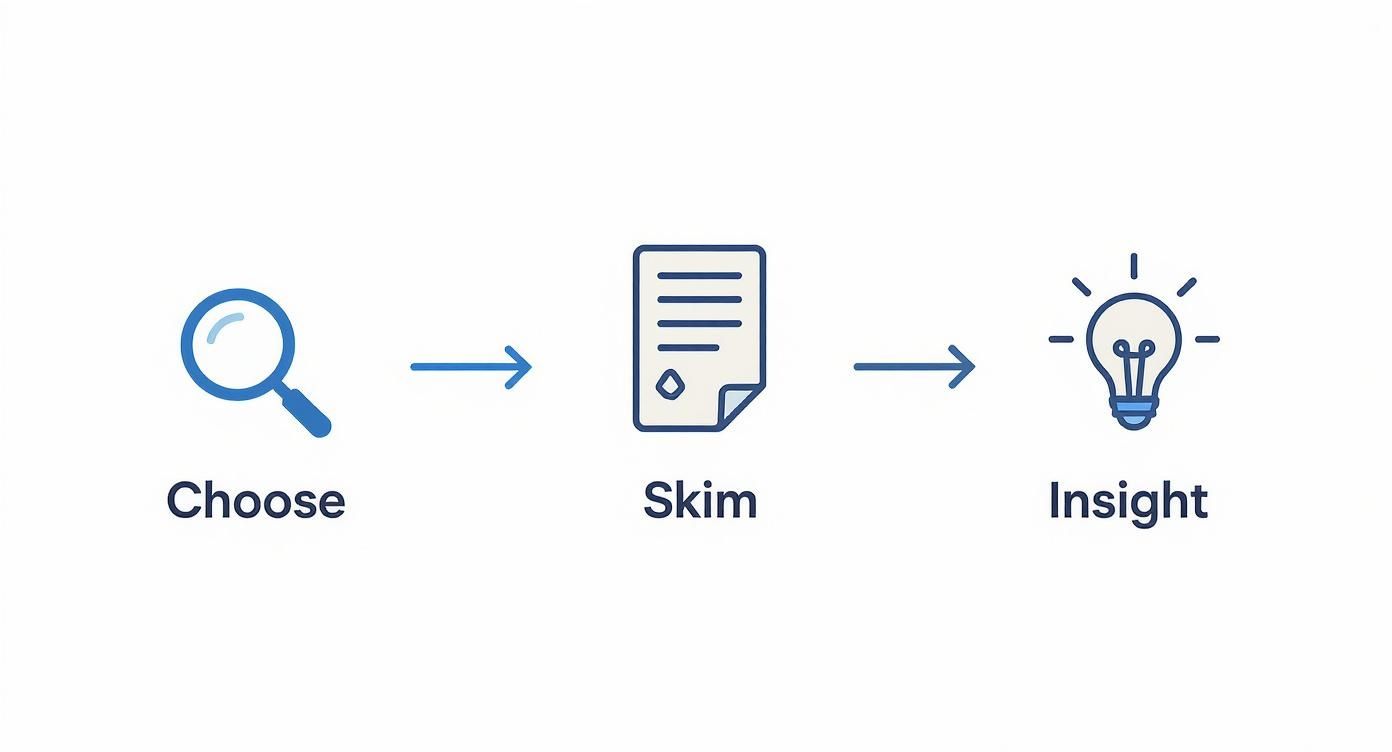
Here’s that process in one glance:
Key Steps Summary
Below is a handy table to bookmark for your next literature session. Keep it open in a tab, refer back whenever you need a quick reminder.
| Action | Purpose |
|---|---|
| Choose | Target studies that directly match your topic |
| Skim | Grasp main questions and outcomes quickly |
| Inspect | Decode visuals for patterns and surprises |
| Evaluate | Assess bias, sample size, and author context |
| Summarize | Record insights in bite-sized notes |
Use this checklist as your reading north star—glance, absorb, and move forward with confidence.
Benefits Of This Approach
- Sharper Focus: You spend energy on relevant content only.
- Less Burnout: Skimming key sections keeps you fresh.
- Deeper Critique: Structured checks build analytical muscle.
- Faster Notes: Clear summaries take seconds to write.
- Stronger Discussions: You’ll walk into meetings armed with evidence.
After a few rounds, sifting through abstracts takes under two minutes, and extracting data from figures can happen in mere seconds. Before you know it, those saved minutes add up—freeing you to draft your own experiments or write manuscripts.
Effective reading matters. On average, adults worldwide read 12 to 15 books each year, yet daily reading in the US fell from 23 minutes in 2004 to 16 minutes recently. Targeted strategies are more important than ever. For a deep dive into these trends, explore the full report at Scioto County Daily News.
Preparing To Read Scientific Papers
When tackling a new batch of research articles, sketch out a plan. Pinpointing a focused research question narrows your scope and guides every next move.
Using Boolean operators like AND, OR, or wildcards helps you zero in on the most relevant studies fast.
Search Filtering Strategies
Filtering by publication date brings the latest findings into view. Sorting by citation count highlights the most influential work. Checking journal impact factors adds another layer of credibility.
However, filtering alone won’t ensure clarity. Dense terminology and domain-specific jargon can still trip you up.
The global adult literacy rate jumped from 10% in 1800 to 87% today, yet uneven access and digital fluency gaps still create hurdles. Learn more about global literacy progress here.
Organizing Your Reading Queue
A balanced reading list mixes background material with urgent studies. Reference managers like Zotero or Mendeley let you tag papers by topic, method, or priority.
If you’re juggling classes and research, these actionable time management tips for students can free up precious hours for your reading sessions.
- Sort articles into folders like “Background,” “Methods,” and “High Priority”
- Flag must-read papers to tackle first
- Sync annotations across devices for seamless access
Time Allocation Techniques
Quickly gauge a paper’s relevance by skimming its abstract in 5–10 minutes. For a thorough section-by-section read, set aside 30–45 minutes.
- Schedule brief review slots to polish your notes
- Keep a consistent routine to avoid random browsing
Block random reading habits to maintain focus and boost productivity.
Comparing Reading Modes
| Reading Mode | Time Block | Objective |
|---|---|---|
| Skimming | 5–10 minutes | Quick relevance check |
| Deep Dive | 30–45 minutes | Thorough understanding of methods |
Switching between these modes makes sure you cover both breadth and depth without getting overwhelmed.
Crafting Advanced Search Queries
Blend keywords with Boolean logic to refine your results:
climate AND adaptationfinds papers that mention both termsgenomics OR proteomicspulls in articles from either fieldneuro*captures neuron, neuroscience, neural alike
Save these refined queries in PubMed alerts or Google Scholar so you catch new publications the moment they drop.
Setting Reading Goals
Imagine you need to review 20 papers in one week for a literature survey. Split the work into two daily sessions:
- Identify five “must-read” studies to start with
- Skim three abstracts every morning to filter out irrelevant work
- Dive into two full texts during the afternoon
Tip: Tune your targets to match upcoming deadlines and your overall workload.
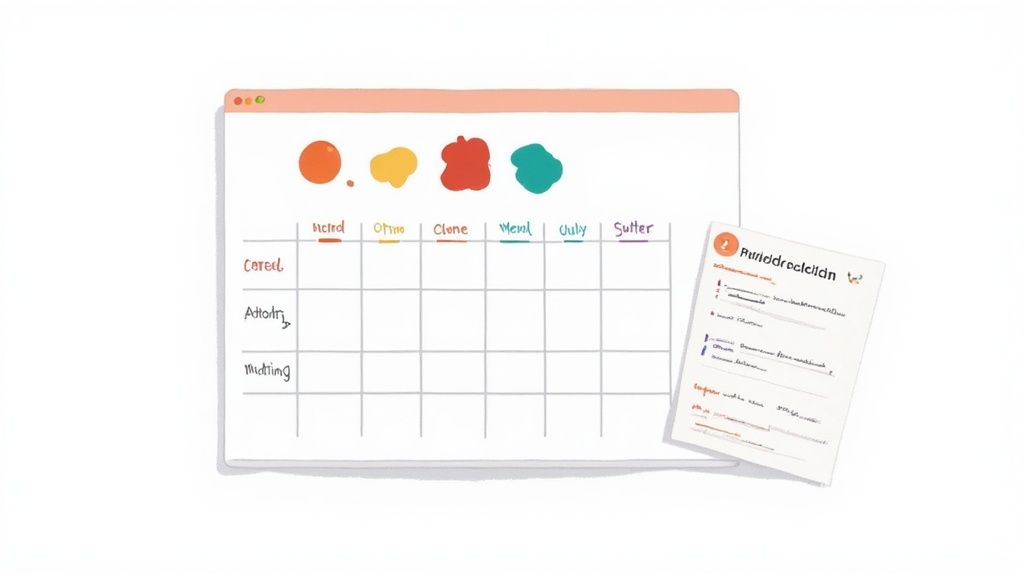
Track your progress in a simple spreadsheet:
- Paper title for easy lookup
- Date read to see your pace
- Key takeaway for quick recall
This blueprint ties together your research question, search filters, reading queue, and goals. Starting every session with this framework slashes wasted effort and keeps you focused on the papers that matter.
Navigating Elements Of Scientific Papers
Skimming smartly prevents you from getting stuck in endless reading loops. Each part of a paper serves a unique purpose, so it pays to know where to zero in first. A quick, high-level pass will save you hours down the road.
The abstract works like a teaser trailer. In 2 minutes or less, pinpoint the study’s objectives, methods and main findings. Think of a biomarker paper in oncology—sample size, control groups and a summary of outcomes usually jump right out.
Before you dive deeper, ask yourself if the goals laid out there align with your project. If the core hypothesis isn’t mentioned, mark it for optional reading later. This trick filters out irrelevant papers when you’re screening dozens in one sitting.
- Abstract Element: Ultra-concise summary of objectives and findings
- Key Metrics: Sample sizes, effect sizes and statistical significance
- Relevance Check: Core questions and context in two sentences
Decoding Figures And Tables
Figures often speak louder than paragraphs. Scan axis labels and legends first to spot trends or anomalies. For example, I once noticed a clear dose–response curve in a neurochemistry study before reading a single line of text.
Tables deliver raw numbers. Keep an eye out for p-values and confidence intervals adjacent to estimates. Comparing control and treatment columns side by side often clarifies significance in seconds.
Sketch quick notes or highlight key bars and data points right on the figure. Once patterns emerge, you can move on without getting bogged down.
| Element | Focus |
|---|---|
| Figures | Visual trends and outliers |
| Tables | Numeric details and metrics |
Scanning The Introduction
The introduction builds the backstory and sets up the hypothesis. Look for gaps in existing knowledge and the specific questions the authors aim to answer—usually in a paragraph or two.
In one nanotech paper, I spotted an unaddressed angle in drug delivery applications. That observation steered my next literature search toward polymer carriers, connecting dots across multiple studies.
“Zeroing in on these introductory gaps saved me countless hours of chasing dead-ends.”
— Dr. Lee, Renewable Energy Researcher
Diving Into Methods
Methods tell you if an experiment is reproducible, but wading through every detail isn’t always necessary. Skim to see if familiar protocols, instruments or reagents appear. Drill down only when you plan to replicate or adapt the work.
When I set up a new cell‐culture workflow, I logged incubation times and media composition directly into a shared spreadsheet. Those quick notes kept me from chasing protocol details later.
- Identify equipment specifications and flag any missing parameters
- Note reagent grades and suppliers for consistency checks
- Highlight custom software versions or scripts
Interpreting Results And Discussion
Results pages are where the rubber meets the road. Zero in on standout statistics—especially anything with p < 0.05—that tie back to your research questions. Don’t let every single test derail your focus.
In the discussion, authors usually point out limitations and suggest follow-ups. Jot down these future‐work ideas—they often become the seeds for your next study.
Key Takeaway: Trends emerge when you compare recommendations across multiple papers.
- Target high-impact results that directly address your objectives
- Note any contradictions with earlier work as caution flags
- Summarize each discussion in two crisp sentences
Conclusions wrap things up by restating the study’s main value. A quick scan here serves as a final reality check before you move on.
Mixing these tactics will boost your reading speed and comprehension. For instant summaries, try a tool like PDF Summarizer to pull out bullet points in seconds, keeping analysis and review balanced.
Next time you open a paper, follow this order: abstract, figures, introduction, methods, results and conclusions. That sequence aligns your focus with your goals and available time.
Sequencing Sections
This workflow brought my literature‐review pace up by 50% faster. Whether you’re evaluating clinical trials or surveying environmental studies, a structured approach pays off.
Choosing Your Reading Focus
Your project dictates where you dig deeper. If you’re replicating experiments, methods and results deserve more attention. If you’re mapping theory gaps, spend extra time on introductions and discussions.
- Mapping Trends: Compare introductions and discussions across 5–10 papers
- Statistical Review: Verify p-values and confidence intervals hold up
Sticking to this roadmap will sharpen your understanding and confidence as you navigate the scientific literature.
Critical Evaluation Methods for Scientific Papers

Few articles survive a close reading unscathed. It’s worth probing the sample size, tracing the funding trail and testing the authors’ own assumptions. With a clear strategy, even the densest result section becomes a set of practical insights.
Spotting Common Biases
Bias can slip in at every turn. Imagine two groups that only differ by age or geography—that’s selection bias making headlines look stronger than they are.
Publication bias hides the nulls and negatives, so always ask if missing data might tell a different story. And confirmation bias? That’s our tendency to cherry-pick anything that mirrors our own hunches.
- Sampling Error pops up when small cohorts misrepresent the wider population, blowing effect sizes out of proportion.
- Selective Reporting is when negative or inconclusive results never see the light of day.
- Conflicts of Interest may be buried in fine print—follow the money to spot subtle influences.
Assessing Statistical Claims
Diving into stats can feel like learning another language. A p-value shows how likely your findings are a fluke. Meanwhile, a confidence interval marks the band within which the true effect most likely falls.
I recommend:
- Checking your sample size to flag underpowered studies
- Comparing p-values across similar tests for consistency
- Scanning confidence intervals for unusually wide or overlapping ranges
An analysis showed declines in reading proficiency in 65% of countries, highlighting that dense scientific language can be a barrier to interpretation. Learn more about reading proficiency findings in the World Bank literacy report.
Weighing Conflicting Results
Conflicting studies aren’t failures—they’re clues. I once set out to compare three trials on a migraine drug, only to see the dose–response flip at higher concentrations. That “aha” moment came by lining up methods and funding sources side by side.
- Break down each study’s design to find methodological quirks
- Track funding disclosures for hidden incentives
- Chart effect sizes in a simple graph to spot real discrepancies
Using Your Critical Checklist
A concise checklist keeps you honest and speeds up your review.
| Checkpoint | Question to Ask |
|---|---|
| Sample Size | Is it large enough for reliable results? |
| Bias Indicators | Are conflicts disclosed or hidden? |
| Statistical Reporting | Do p-values and CIs paint a clear picture? |
| Reproducibility Claims | Can I access raw data or protocols? |
Keep your questions ready before reading to quickly flag issues.
Verifying reproducibility often means hunting down raw data or detailed protocols. Tools like PDF Summarizer help you pull methods and outcomes side by side without endless scrolling.
When you finish your critique, you’ll know exactly which papers deserve a spot on your reading list.
Cross-Study Synthesis
Reading one paper at a time hides the bigger story. By grouping studies—say, all those using surveys versus lab experiments—you’ll spot recurring themes or surprising gaps.
- Build a matrix that lines up sample sizes, effects and limitations
- Highlight where results diverge or data are missing
- Use that table as the backbone of your next literature review
Looking at air pollution research this way exposed a geographic bias: most urban studies come from Europe, leaving rural areas underrepresented.
Key Takeaways
- Critical reading turns guesswork into solid judgments
- Questioning p-values and confidence intervals stops you from overinterpreting noise
- Tools like PDF Summarizer shave hours off your workflow
- A printed checklist guarantees the same level of scrutiny every time
Consistency in critique turns reading into a repeatable skill, not a guessing game.
Print your checklist, jot notes in margins and revisit flagged sections before you cite any study. These habits raise your paper-reading from passive browsing to active analysis.
Practical Example
Imagine a nutrition trial that claims a supplement cuts fatigue in athletes. The researchers report p = 0.04, but each group only had 12 participants. Applying our checklist, you’d question whether n = 12 provides enough power and check if the raw data are available for reanalysis. That way, a daunting methods section becomes a chance to sharpen your own research design.
Note Taking Strategies for Scientific Papers
Tackling a new study demands more than passive reading. Jotting down questions, reactions, and summaries as you go keeps ideas from slipping through the cracks. Over time, you’ll build a personal roadmap through the literature.
On your computer, annotation features in PDF readers let you highlight a critical phrase and pin a comment right on the margin. If you prefer pen and paper, grab a spiral notebook and a handful of color-coded sticky flags—each hue representing a theme or section.
- PDF Annotation Layers: Bold highlights and line-specific comments make it easy to revisit crucial points.
- Cornell Note Template: A two-column framework for cues and detailed notes, plus a summary strip at the bottom.
- Mind Maps: Sketch bubbles for hypotheses, methods, and findings to see the big picture.
- Keyword Tags: Assign 3–5 descriptive tags per paper so you can filter your notes instantly.
Cornell layouts guide you from jotting down main ideas to crafting ready-to-use flashcards.
Mind maps help you connect dots—say, linking a paleobotany paper’s carbon-dating approach back to broader climate patterns.
Organizing And Cross Referencing
Always tie your notes back to page or figure numbers so you can trace an insight to its source. If you’re in a digital environment, embed hyperlinks that whisk you back to the original spot in seconds.
Pair your notes with reference managers like Zotero or Mendeley to keep author names, titles, and publication details at your fingertips. This turns a jumble of PDF files into a searchable archive.
| Field | Example Entry |
|---|---|
| Author | Smith et al., 2023 |
| Journal | Journal of Ecology |
| Keywords | biodiversity, carbon flux |
| Page | 12 |
Mixing analog and digital methods means you can switch smoothly from desk to café without missing a beat.
Balancing Depth And Speed
When you’ve got a stack of papers waiting, set a timer. Focusing on high-level takeaways first preserves momentum and prevents burnout.
- Timer Method: Allocate 5 minutes per section to capture overarching ideas.
- Voice Memos: Record quick audio notes on your phone and transcribe when you have a moment.
- Snapshot Notes: Snag screenshots of tables or figures, then annotate right away.
Storing annotated PDFs in a shared cloud folder keeps everyone on your team aligned and sidesteps version conflicts.
Writing Effective Summaries
Once you’ve read a section, challenge yourself to write two sentences in your own words. That short exercise cements comprehension far better than copying the abstract.
In my renewable-energy review, finishing each note with a mini gap analysis revealed a surprising oversight in wind-turbine noise studies.
Brief summaries generate durable memory and highlight where further questions arise.
- Who and Why: Capture who led the research and its purpose.
- What and How: Outline the core experiment or analysis steps.
- Key Numbers: Flag any p < 0.05 results or unusual sample sizes.
Dive deeper into advanced AI-powered note workflows in our article at PDF Summarizer blog.
For digital note-takers, exploring the best note-taking apps can streamline your process and keep your research organized.
By weaving analog habits with smart digital tools, you’ll create a living research asset you can revisit and expand as your project grows. Keep refining those notes, and new insights will emerge.
Synthesizing Insights From Scientific Papers
Reading one article at a time can leave gaps in your understanding. When you weave findings from several studies together, overarching patterns jump out—ones you’d never catch by skimming each paper in isolation.
Real projects thrive on connecting the dots, building a cohesive story and uncovering emerging trends that guide your next steps.
Grouping Studies By Theme
Tagging papers with thematic labels makes it easy to sift through dozens of sources. Choose one or two descriptors—anything from research design to population or intervention focus.
- Machine learning papers often converge around performance benchmarks.
- Patient satisfaction surveys repeatedly highlight accessibility and clear communication.
- Environmental field studies underscore regional policy effects and climate variables.
Building Comparison Matrices
A simple table can illuminate disparities in methodology, sample size and results.
| Methodology | Sample Size | Key Outcome |
|---|---|---|
| Randomized Trial | 200 | 20% reduction |
| Qualitative Study | 35 | Rich thematic data |
| Survey Analysis | 500 | 73% positive |
This layout brings inconsistencies into focus immediately.
Spotting Trends And Gaps
Once you’ve grouped and tabulated your sources, trends become readable at a glance.
- Converging results validate robust effects and inform meta-analyses.
- Diverging outcomes point to context-specific variables worth exploring.
- Missing methods or unpublished data raise questions about reproducibility.
Key Takeaway
Patterns really emerge when you line up studies by theme and metric.
Printable Review Checklist
Keep this list on your desk or pinned digitally to prevent critical oversights:
- Relevance Filters: Quick questions on scope and applicability.
- Appraisal Prompts: Target bias, validity and statistical rigor.
- Note Fields: Space for themes, methods and standout results.
- Comparison Matrix Section: A ready-made grid to fill in.
- Gap Analysis Guide: Prompts to flag unexplored areas.
Tick each item as you move through papers—your narrative stays crisp, and you won’t lose track of vital details.
Next Steps For Cohesive Writing
With your themes and matrix in hand, drafting an introduction becomes a breeze.
- Open by referencing a cluster of studies from your thematic tags.
- Tie every assertion to at least two sources for solid backing.
- Conclude with a clear gap statement that paves the way to your research question.
This approach transforms a list of citations into a flowing narrative. And if you want to speed up matrix creation, give PDF Summarizer a try—it extracts themes and tables across multiple PDFs.
Example Case Study
In a meta-review of twelve nutrition trials, a synthesis matrix tracked dosage, sample size and outcomes. Labeling interventions exposed a consistent underreporting of side effects in smaller cohorts.
- Subgroups under fifty participants reported 30% fewer adverse events.
- Studies with over two hundred participants showed 12% less variability in efficacy.
Discovering that gap set the stage for a follow-up focused on underpowered groups.
Creating Reproducible Review Plans
A solid review plan spells out every decision—from selection criteria to narrative structure.
- Objective Statement: A concise goal that guides your scope.
- Inclusion Filters: Language, publication date and journal standards.
- Exclusion Log: Justifications for omitted papers to maintain transparency.
Recording these steps means colleagues can replicate your process or build on your framework.
Effective synthesis transforms reading into strategic discovery and fuels impactful research.
Best Practices You Need To Know
- Update your matrix as new studies surface to keep your review current.
- Refine your checklist periodically to align with the evolving literature.
- Share your documents with peers for feedback and validation.
- Combine quantitative and qualitative insights to capture both numbers and narratives.
- Maintain a living document for fresh references, annotations and reflections.
Happy synthesizing journey.
Frequently Asked Questions
Zeroing in on the right articles often feels like a scavenger hunt. I always keep my main research question front and center and skim abstracts for specific terms and outcomes.
- Use citation counts and publication dates to weed out older or low-impact studies.
- Apply Boolean operators like AND and OR to tighten up your search.
- Preview figures with PDF Summarizer to get a quick sense of the experimental setup.
When the stats section seems like a foreign language, break it down. I scan for p-values and confidence intervals first, then run simple scripts or online calculators to reproduce effect sizes.
Key Insight
Sometimes a single metric—say, a 95% confidence interval—illuminates the entire result.
Handling Statistical Results
Laying out numbers in a compact table makes comparisons crystal clear. Below is an example format I’ve found invaluable:
| Paper ID | Sample Size | Main Outcome |
|---|---|---|
| Smith et al. | 30 participants | 20% drop in error |
| Lee et al. | 50 participants | 15% speed gain |
Tracking Research Ideas
When you’re juggling dozens of PDFs, a tagging system saves your sanity. I use Zotero or Mendeley for metadata and then let PDF Summarizer’s multi-file chat pull out recurring themes.
- Tag each study by methodology and core findings
- Build a shared spreadsheet with columns for hypotheses and gaps
- Maintain versioned notes so you can trace your thought process
- Scan citation lists to spot consensus or debate across papers
A quick matrix once uncovered a surprising pattern in neuroimaging workflows.
Guard against bias by checking funding sources and conflicts of interest right up front. I flip to acknowledgments first, then scan methods for red flags like tiny cohorts or missing controls.
This routine has shaved off hours every week.
No signup needed.
Start free now.
Guaranteed reliability.
Access on any device with full encryption.
Ready to speed up your literature review? Try PDF Summarizer
Relevant articles

Streamline your research and summary tasks with AI. Analyze documents, synthesize insights, and craft sharper reports, faster and with confidence.

Master taking notes on a pdf with practical annotations, smart organization, and AI tools to boost understanding and retention.
Learn what is synthesizing information and move beyond simple summaries. Discover how to connect ideas from multiple sources to create powerful new insights.

Struggling with dense texts? Learn how to read research papers efficiently with our concise guide and practical strategies.
Become a more effective literature review writer with our guide. Learn to plan, research, and write faster using AI tools ethically and efficiently.
Discover how to write review paper with a practical approach. Learn topic selection, literature synthesis, and crafting a compelling narrative to boost impact.