Your Guide to the Literature Review Matrix Template
Struggling with research? Our literature review matrix template helps you synthesize sources, spot patterns, and write faster. Learn how to use it effectively.

At its heart, a literature review matrix is your command center for research. It’s a simple but incredibly effective spreadsheet designed to help you organize, analyze, and make sense of all the academic sources you’re juggling. Think of it as a framework that forces you to break down dense, complicated papers into their essential parts—like their methods, findings, and weak spots. This process turns a chaotic pile of PDFs into actionable clarity.
Taming the Research Beast With a Matrix Template
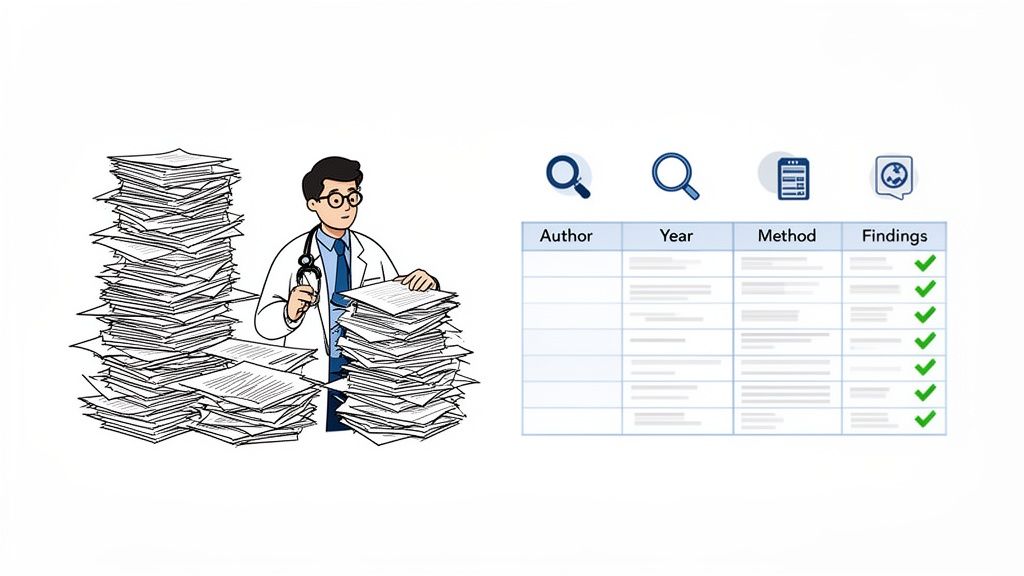
Staring down a mountain of research papers is enough to make anyone feel overwhelmed. Every single PDF represents hours of someone else's work, packed with complex ideas and critical data. Without a solid system, it's easy to drown in information, completely missing the connections, contradictions, and—most importantly—the gaps your own research is supposed to fill.
This is exactly where a literature review matrix shines. It’s more than just an organizational tool; it becomes a strategic partner in your research. It’s not just a spreadsheet, but a new way of thinking that pushes you to actively analyze each source, rather than just passively reading it.
By breaking every study down into the same set of comparable pieces, you start building a powerful, personalized knowledge base. This methodical approach is the secret to managing the inherent complexity of academic research and building a rock-solid foundation for your own work.
Where Did the Research Matrix Come From?
The literature review matrix didn't just pop up out of nowhere. It evolved as a direct response to the absolute explosion of academic publishing. In modern research, it's not uncommon to screen hundreds of articles for a single project. In fact, a 2019 analysis found the median number of records screened for a systematic review was a staggering 1,167, with some researchers sifting through over 10,000 citations.
Trying to track key findings across that many studies without a structured matrix is next to impossible. It's why this tool has become a non-negotiable staple in graduate programs everywhere.
When you're facing that kind of information overload, a structured plan is everything. It’s a lot like using structured time and task management tools to bring order to your daily workflow. The matrix simply imposes that same necessary order on the chaos of deep research.
The Understated Power of a Simple Spreadsheet
At its core, the matrix is a synthesis machine. It helps you finally see the forest for the trees by laying out all the critical pieces of information side-by-side. This visual alignment makes patterns, which would otherwise stay hidden, jump right off the page.
Just look at what it helps you do:
- Spot Patterns: You can easily group studies by their methodology, theoretical lens, or findings to see trends emerge.
- Identify Gaps: The empty cells in your matrix are often the most telling. They scream out what isn't being said, pointing you directly toward valuable research opportunities.
- Build Your Argument: When it's time to write, you can pull evidence from your matrix to support different parts of your argument, ensuring every claim is backed up.
- Boost Your Efficiency: No more re-reading entire articles just to find that one key detail. A quick scan of your matrix gives you a refresher on a study's main points, saving you countless hours.
A well-built literature review matrix isn't just a static note-taking system. It's a dynamic analytical tool that evolves with your understanding and actively helps you craft a coherent, evidence-based story.
This structured approach is absolutely critical for intensive projects like a systematic literature review. If you want to dive deeper, our guide on https://pdfsummarizer.pro/blog/systematic-literature-review-methodology explores the rigorous processes where a matrix isn't just helpful—it's essential.
Ultimately, the matrix is the bridge between collecting information and creating new knowledge. It empowers you to stop summarizing sources and start synthesizing them, ensuring your final paper is a compelling argument, not just a book report on what everyone else has already said.
How to Design a Matrix That Actually Works for Your Research
A downloadable template is a great starting point, but let's be honest—its real value comes from making it your own. Think of a template as the basic frame of a house. You're the one who has to put up the walls and decide where the windows go, all based on the specific needs of your research. A generic matrix stores information; a custom one helps you build an argument.
The trick is to move beyond the basic "Author," "Year," and "Title" columns. Sure, you need those for your bibliography, but they won't help you with the heavy lifting of analysis. The real work starts when you design columns that force you to break down each study in a way that feeds directly into your synthesis, helping you spot the narrative thread tying all your sources together.
It All Starts With Your Research Question
Before you even think about adding columns, get laser-focused on your central research question. Every single column you add must be a tool to help you answer that question. If it doesn't serve that primary goal, it's just clutter that creates more work for you down the line.
Let's walk through a real-world scenario. Imagine you're researching the adoption of AI in small businesses. Your guiding question might be something like: "What are the main drivers and barriers influencing AI adoption among small and medium-sized enterprises (SMEs)?"
With that question front and center, you can now brainstorm columns that will pull the most relevant details from every single paper you read. This simple shift in thinking turns your matrix from a glorified spreadsheet into a powerful analytical machine.
Building Your Analytical Columns: A Practical Example
For our researcher looking into AI and SMEs, basic bibliographic info just won't cut it. They need columns that let them compare and contrast findings in a meaningful way.
Based on their research question, here are some of the analytical columns they might add to their literature review matrix template:
- Theoretical Framework: Is the study grounded in the Technology Acceptance Model (TAM), Diffusion of Innovations Theory, or another model? This helps you group studies by their core conceptual approach.
- Key Variables Studied: What specific factors did the authors measure? Think perceived usefulness, implementation cost, employee skill gaps, or competitive pressure.
- Identified Drivers: What factors did the study find that encourage AI adoption? This column isolates all the positive influences.
- Identified Barriers: On the flip side, what did the study find that discourages adoption? This helps you categorize all the challenges.
- Industry Focus: Was the research focused on retail, manufacturing, professional services, or a mix? This allows for much-needed, sector-specific analysis.
- Unique Contribution: What's this paper’s main claim or novel finding? This forces you to pinpoint what makes each source unique.
See how every one of these columns ties directly back to the central research question? When our researcher fills these out, they aren't just taking notes; they're systematically deconstructing each article into puzzle pieces that can be reassembled into a new, compelling argument.
Moving From Data Points to Genuine Insights
The real magic happens once you start sorting and filtering your custom matrix. After you’ve processed 20 or 30 papers, you can start asking powerful questions of your own data.
Our researcher could filter their matrix to only show studies that focused on the retail industry. Suddenly, a pattern might emerge: maybe cost is the biggest barrier in retail, while a lack of in-house technical skills is the showstopper in manufacturing. That's the kind of sharp insight that becomes the backbone of a stellar literature review.
The point of a custom matrix isn't just to warehouse quotes. It's to build a dataset about your literature—one you can query, sort, and analyze to find trends, contradictions, and gaps that no single paper could ever show you.
This process is also fantastic for revealing what isn't being talked about. If the "Industry Focus" column is almost entirely "Manufacturing," our researcher has just stumbled upon a major gap: there's a clear lack of research on AI adoption in service-based SMEs. That discovery alone could become a cornerstone of their own study's contribution.
Ultimately, designing your matrix is the first real step in your analysis. By being thoughtful and strategic with your columns, you're building a tool that will do more than just keep you organized—it will actively guide your thinking and help you build an original argument that truly contributes to your field.
Want to Fill Your Matrix Faster? Try Using AI
Let's be honest. Manually digging through dozens—sometimes hundreds—of dense academic PDFs is the biggest time-sink in any literature review. Pulling out key details like methodology, sample size, limitations, and findings for your matrix is a slow, mind-numbing task that can drag on for weeks. This is where modern AI tools can completely change your game.
Instead of reading every single line, you can use an AI-powered tool like PDF Summarizer to ask direct questions across your entire library of sources at once. You stop being a data entry clerk and become a research strategist, free to focus on analysis instead of manual labor.
Before you even start filling in the cells, your process should look something like this.
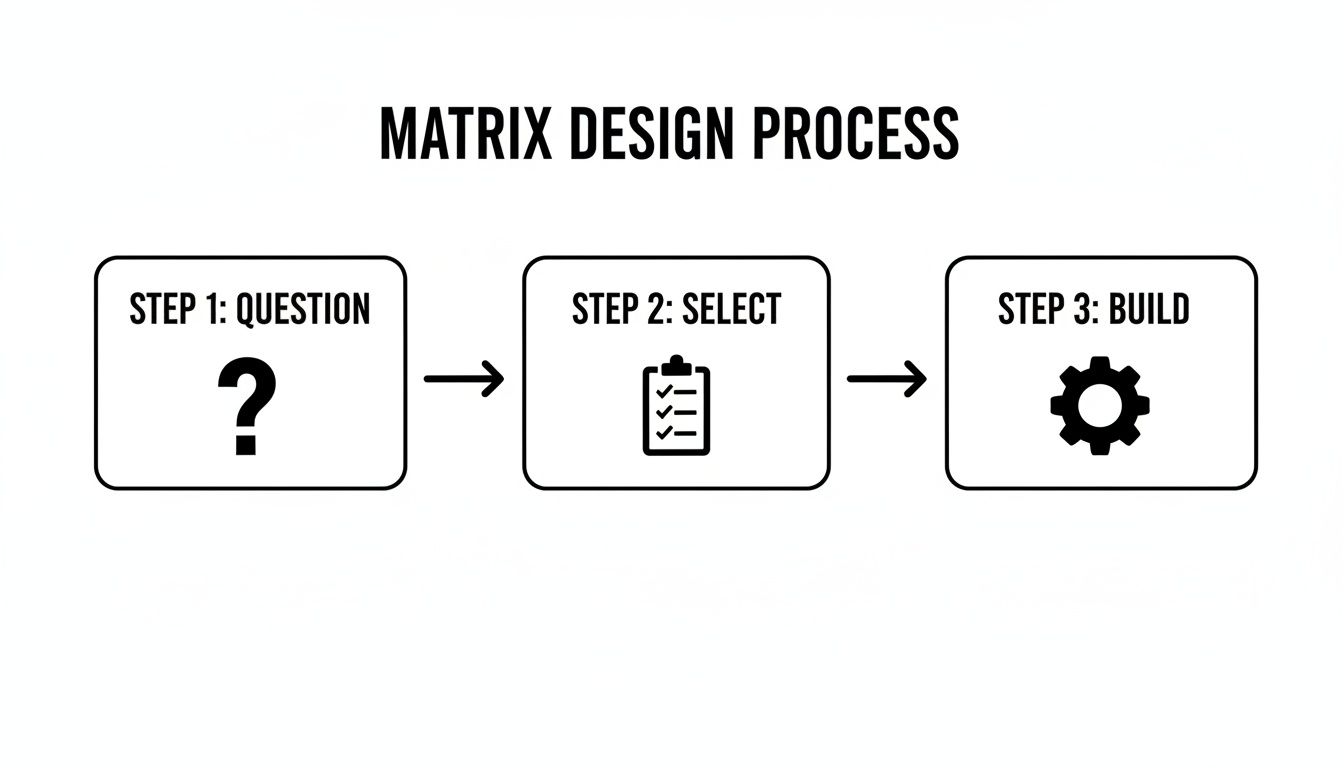
This workflow drives home a critical point: the quality of your matrix comes from the thinking you do upfront. Define your core question, choose the right columns, and then build the structure.
From Manual Extraction to Smart Queries
The old way is painful. You open one PDF, read it, hunt for the information, and type it into your spreadsheet. Then you do it all over again for the next 40 papers. Not only is it slow, but it’s also inconsistent. Your focus and interpretation will inevitably drift over time.
AI gives you a much more direct route. After uploading all your source documents, you can use a multi-file chat feature to query your entire research library at the same time. Think of it as having a research assistant who has memorized every single paper and can instantly pull the exact information you need. For anyone working with a literature review matrix template, this is a massive leap forward.
How to Ask the Right Questions
The secret to getting high-quality data for your matrix is learning how to craft the right prompts. Your questions need to be specific and structured to pull the precise information for each column. If you ask vague questions, you'll get vague, unhelpful answers.
Here are a few examples of targeted prompts that actually work:
- For Methodology & Sample Size: "For each paper, identify the research methodology (e.g., qualitative, quantitative, mixed-methods) and the exact sample size. Put this in a table with columns for 'Source,' 'Methodology,' and 'Sample Size'."
- For Key Findings: "Summarize the main conclusions from each source about the barriers to AI adoption in small businesses."
- For Limitations: "Extract any limitations, weaknesses, or ideas for future research mentioned by the authors in each document."
See how these prompts are framed as direct commands? They tell the AI exactly what to find and even how to format it. That clarity is what gets you consistent, clean data that you can copy and paste right into your matrix.
By writing precise prompts, you're essentially programming the AI to do the tedious extraction work for you. The more specific your instructions, the more accurate the output.
For an even bigger boost in efficiency, you can look into tools with AI Autoparse functionality, which are designed to automatically pull structured data from different sources. This aligns perfectly with the goal of populating your matrix in record time.
Verifying Information Without Losing Speed
One of the biggest hang-ups people have with AI is accuracy. How do you trust the extracted information without re-reading the whole document yourself? The answer is clickable citations.
A good AI tool doesn't just give you an answer; it shows you exactly where it came from. PDF Summarizer, for instance, provides citations with its responses. When you click one, it takes you to the specific page and highlights the source text.
This feature lets you maintain academic integrity while moving at a much faster pace. Here’s how a smart workflow looks:
- Run Your Prompt: Ask the AI to extract data for a specific column, like, "What were the key dependent variables measured in these studies?"
- Review the Output: Quickly scan the AI's summary for clarity and relevance.
- Spot-Check with Citations: Click a few of the citations to make sure the information was interpreted correctly and is in the right context.
This "trust but verify" method is the sweet spot between automation and your own expert oversight. You can move quickly, confident that the data in your matrix is both accurate and properly sourced. And if you're curious about how AI can help with the writing itself, our guide on using an AI-powered literature review writer is a great next step.
By folding these AI techniques into your process, you can cut down the time spent on manual data entry by as much as 60-70%. That frees you up to focus on what really matters: synthesizing information, finding patterns, and building a powerful argument for your research.
Turning Your Organized Data Into a Coherent Narrative
A perfectly filled-out literature review matrix is a thing of beauty, but it's not the final product. Think of it as your launchpad, not the destination. Its real power comes alive when you translate that structured data into a flowing, persuasive argument. This next phase is all about the art of synthesis—moving from organizing information to creating genuine insight.
This is where you stop just summarizing papers and start building a scholarly conversation. Your matrix has laid all the pieces of the puzzle out on the table; now, it's your job to put them together and reveal the bigger picture. You'll be spotting patterns, pointing out contradictions, and building a story that walks your reader through the existing research, leading them right to the gap your work is about to fill.
From Rows and Columns to Themes and Arguments
The first trick to building your narrative is to stop seeing individual rows and start seeing potential groups. Your spreadsheet software is more than just a place to store notes; its sorting and filtering functions are your secret weapon for analysis. By slicing and dicing your matrix in different ways, you can make hidden connections and major themes jump right off the screen.
Think about all the ways you can rearrange your data. Each new view gives you a different angle on the literature.
- Group by Methodology: Filter your matrix so you’re only looking at quantitative studies, then switch to the qualitative ones. Do you notice that studies using a particular method almost always land on similar conclusions? That could be a cornerstone of a whole section of your review.
- Sort by Publication Year: Arranging your sources from oldest to newest can instantly reveal how thinking has evolved in your field. You can literally trace how a key theory was tweaked, challenged, or even abandoned over time.
- Filter by Theoretical Framework: What happens when you group studies by the theories they lean on? Suddenly, you can see the different schools of thought. This is perfect for framing a discussion around a debate between competing models.
The goal isn't just to rearrange cells on a screen. It's to ask new questions of your organized information. Every sort and filter is like a mini-experiment, a new way to peel back a layer and understand the literature as a whole.
This kind of hands-on manipulation is what separates a true synthesis from a simple list of summaries. It’s how you start building paragraphs around big ideas, not just individual authors. For a deeper dive into this part of the process, our full guide on how to write a literature review lays out a complete framework.
Drafting Directly From Your Matrix
Once you've spotted a theme, your matrix becomes an incredible tool for drafting your summary statements. This is easily one of the most efficient ways to start writing because your evidence is already lined up and ready to go. You can move from an "aha!" moment to a fully formed paragraph in minutes.
Let's say you've sorted your matrix by "Industry Focus" and noticed a clear split in the findings. Your matrix gives you the exact data points you need to build a powerful, evidence-backed statement.
Real-World Example
Imagine your matrix contains nine studies on service-based businesses and six on manufacturing firms. After filtering, you see a pattern in the challenges they report. You can immediately draft a synthesis statement like this:
"A clear divide emerges when analyzing AI adoption barriers across different sectors. Studies focused on service-based businesses (n=9) consistently highlight integration costs and a lack of interoperability with existing systems as the primary obstacles. In contrast, research concentrated on manufacturing firms (n=6) points more frequently to a lack of specialized technical expertise and resistance to retraining the existing workforce."
In one fell swoop, that statement does a few things:
- It synthesizes findings from 15 different studies.
- It establishes a clear point of contrast.
- It uses data pulled straight from your matrix (the 'n' counts) to add authority.
This method acts as the perfect bridge, connecting your raw data directly to your final written review.
Structuring Your Narrative Flow
With a few of these synthesis statements drafted, you can start thinking about the bigger picture—the overall structure of your literature review's body. Your matrix helps here, too. The themes you uncovered through all that sorting and filtering often become the natural subheadings for your paper.
Think about these common organizational structures, all of which your matrix can guide:
| Structure Type | Description | How Your Matrix Helps |
|---|---|---|
| Thematic | Organized around recurring topics, themes, or concepts that appear across multiple sources. | Use filtering to group studies that address the same theme, forming the basis for each section. |
| Chronological | Presents the literature as it developed over time, showing the evolution of research in the field. | Sort your matrix by the 'Year' column to easily trace the historical progression of ideas. |
| Methodological | Groups studies based on the research methods they employed (e.g., qualitative vs. quantitative). | Filter by your 'Methodology' column to compare and contrast the findings produced by different research approaches. |
When you treat your literature review matrix as an active partner in the writing process, you guarantee that your final narrative is deeply rooted in the evidence you've worked so hard to collect. It turns your spreadsheet from a static database into a dynamic tool for generating original, compelling insights.
7 Best Practices (and Common Pitfalls) for Your Matrix
A literature review matrix is one of the most powerful tools in a researcher's toolkit. But I've seen it happen time and time again: what starts as a source of clarity can quickly devolve into a messy, confusing spreadsheet that actually creates more work.
The key is building good habits from the very beginning. A little discipline upfront will save you from a world of headaches later on.
The "Kitchen Sink" Column Problem
One of the most common traps I see researchers fall into is adding a column for every single detail imaginable. The thinking is that more data is always better, right? Not exactly. This usually results in a massive, unwieldy spreadsheet where half the cells are empty, making it impossible to see the forest for the trees. You can't spot patterns when you're scrolling horizontally for miles.
The Chaos of Inconsistency
Another classic mistake is inconsistent data entry. One day you might log a study's method as "Qualitative Interview," and the next, you'll jot down "Interviews (Qual.)." While you know they mean the same thing, that tiny difference breaks your ability to sort and filter your data. It completely undermines one of the main reasons you're using a literature review matrix template in the first place.
This problem pops up everywhere. Maybe you forget to grab the page number for a killer quote, sending you on a wild goose chase through a 50-page PDF a month later. These small oversights pile up, slowly chipping away at your matrix's reliability and costing you hours of rework when it’s time to start writing.
A great literature review matrix isn’t defined by how much information it holds, but by how consistently and purposefully that information is structured. Its goal is to reveal insights, not just store data.
To keep your matrix clean and genuinely useful, let's look at some simple but effective habits you can build into your workflow.
Keeping Your Matrix Clean and Functional
Think of these practices as creating a system that protects you from your future, tired self—the one who just wants to find that one statistic without having to decipher a month's worth of messy notes.
Here are some strategies that have worked for countless researchers:
- Create a "Data Dictionary": This sounds formal, but it's simple. On a separate tab in your spreadsheet, define what each column means and—this is crucial—create a "codebook" for your terms. For example, decide that all qualitative studies will be tagged "QL" and quantitative studies "QN." Stick to it.
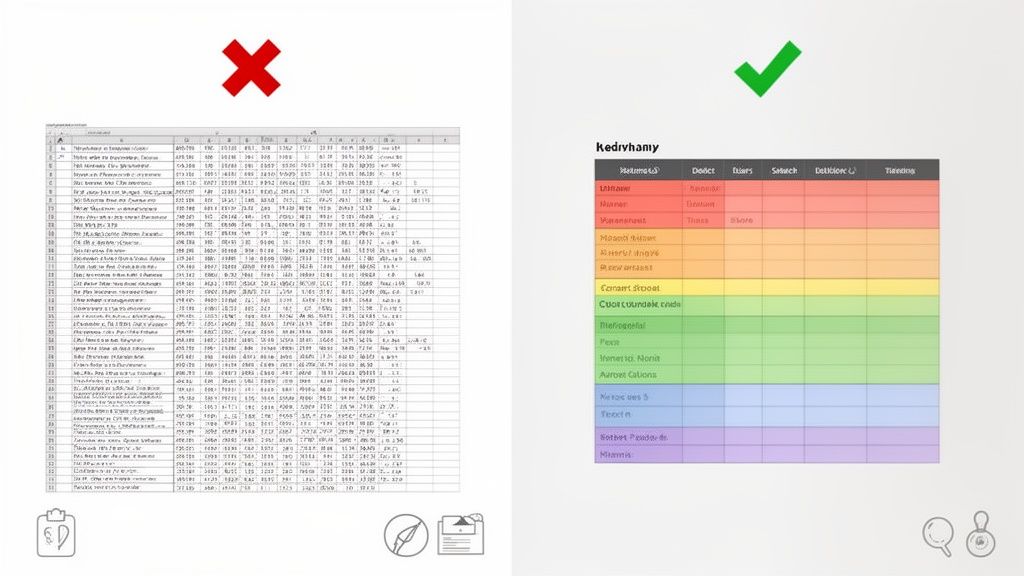
- Color-Code Your Themes: As you start noticing recurring ideas or themes, use your spreadsheet’s highlighting feature to color-code the rows. Maybe all studies related to "implementation challenges" are green, while those focusing on "user adoption rates" are yellow. This gives you a powerful, at-a-glance visual map of your research landscape.
- Schedule Quick Consistency Audits: This is a lifesaver. Block out just 15 minutes every week to scan your matrix. Sort a few different columns and look for anything that seems off. Catching a mistake when you have 20 sources is easy; finding it when you have 100 is a nightmare.
Effective Matrix Habits vs Common Pitfalls
To make it even clearer, here’s a quick comparison of the habits that lead to a useful matrix versus the common mistakes that create confusion.
| Best Practice (Do) | Common Pitfall (Don't) |
|---|---|
| Be Selective with Columns: Only include columns that directly answer your research questions. | Add Too Many Columns: Creating dozens of columns "just in case" leads to a cluttered, unusable sheet. |
| Use a Data Dictionary: Standardize your terminology (e.g., QL for qualitative) from day one. | Enter Data Inconsistently: Using different terms for the same concept (e.g., "survey" vs. "questionnaire") breaks filtering. |
| Color-Code by Theme: Use visual cues to quickly identify patterns and connections between studies. | Keep it All Black and White: A wall of text makes it difficult to spot thematic clusters visually. |
| Always Note Page Numbers: For every quote or specific claim, record the exact page number immediately. | Forget to Cite As You Go: Leaving page numbers or full citations for later causes massive rework. |
| Summarize in Your Own Words: Briefly paraphrase the key findings to ensure you understand them. | Copy-Paste Huge Chunks of Text: Large blocks of text make the matrix hard to scan and can lead to unintentional plagiarism. |
| Set Time for Regular Review: A quick 15-minute weekly check keeps the data clean and consistent. | Let It Grow Unchecked: Waiting until you have 100+ entries to organize is a recipe for disaster. |
| Keep It Focused: Your matrix should serve your research, not become a project in itself. | Treat it Like an Archive: The goal is synthesis and analysis, not just data storage. |
By adopting the right practices, your matrix stops being a simple data repository and becomes a dynamic analytical partner. This structured approach ensures that when you're deep in the research trenches, your matrix is a source of clarity, not chaos.
Got Questions About Literature Review Matrices? We've Got Answers
Even with the best tools, questions are bound to come up. When you first dive into using a literature review matrix template, it's normal to hit a few small roadblocks. Getting these sorted out early on saves you a ton of frustration and keeps your research flowing smoothly.
Let's walk through some of the most common questions researchers ask. Clearing these up from the get-go will help you sidestep a few pitfalls and make this tool work for you.
How Many Columns Should I Actually Use?
There's no single magic number, but from my experience, the sweet spot is usually between 8 and 15 columns. If you have fewer than eight, you risk not capturing enough detail to do a real synthesis. Go over fifteen, and the whole thing can become a monster that's impossible to manage on one screen.
My advice? Start with the non-negotiables: Author, Year, Purpose, Methodology, and Key Findings. From there, think about what's unique to your research question and add a few custom columns. The golden rule is that every column must serve a clear purpose—if it doesn't help you compare and contrast your sources, cut it.
Does This Work for Both Qualitative and Quantitative Research?
Absolutely. The matrix is a chameleon; it works brilliantly for both. The trick is simply to customize your columns to pull out the right kind of information.
- For quantitative studies: You'll want columns like "Sample Size," "Statistical Tests Used," and "Key Variables."
- For qualitative studies: Your columns will lean more toward "Research Setting," "Data Collection Methods" (e.g., interviews, ethnography), and "Major Themes Identified."
Reviewing mixed-methods literature? No problem. You can either create a single, comprehensive matrix with columns for both types of data or just add a "Study Type" column to make filtering a breeze.
A matrix is meant to be flexible. Don't feel boxed in by a rigid format. Adapt it to the actual literature you're reviewing. The goal is clarity, not just conforming to a template.
What's the Best Software for Building My Matrix?
Hands down, spreadsheet software is the way to go. Tools like Microsoft Excel or Google Sheets are perfect for this because of their powerful sorting, filtering, and color-coding features—all of which are essential for the analysis phase.
I'm a big fan of Google Sheets because it's cloud-based. This means you can access your matrix from anywhere and easily share it with your supervisor or research partners for real-time collaboration. While you could use a table in a word processor, you'd miss out on all the dynamic features that make spreadsheets the ideal choice for this task.
Ready to spend less time wrestling with PDFs and more time synthesizing your findings? The AI-powered tools at PDF Summarizer can help you pull out key data, find quotes, and populate your matrix in a fraction of the time. Chat with your documents for free on pdfsummarizer.pro.
Relevant articles

Learn how to add citations in Google Docs using the built-in tool, add-ons like Zotero, and an advanced PDF workflow. Master APA, MLA, and Chicago styles.

Unlock what is meta analysis in research. This guide explains how it combines studies for powerful insights, covering key concepts, steps, and common pitfalls.

Learn the systematic literature review methodology from start to finish. A practical guide on defining questions, searching, screening, and synthesizing data.

Discover how to write literature review effectively—from planning and searching to synthesis and writing.
Discover how to write review paper with a practical approach. Learn topic selection, literature synthesis, and crafting a compelling narrative to boost impact.

Discover the best AI tools for academic research. Our curated list covers literature reviews, data extraction, writing, and summarization to speed up your work.